Honeypot ADR
Application Detection and Response. It sees and stops attacks on your application at the level of the attacker, not the level of the request.
WAF, anti-DDoS and bot protection on one platform. Traffic never leaves Uzbekistan.
ADR (Application Detection and Response) is an approach that has emerged over the past few years. It follows the same logic as EDR in endpoint protection and NDR in network protection, only the layer is different: the application layer.
A classic WAF (Web Application Firewall) answers one question: “is this request malicious?” Every request is matched against a rule set, and there are two possible answers: pass or block. Once the request is served, the WAF forgets it.
ADR answers a different question: “who is this, what are they trying to do, and what should we do about it?” Every client is tracked across the session, its behaviour accumulates, attack stages are identified, and the response is delivered in stages.
| Aspect | Classic WAF | Honeypot ADR |
|---|---|---|
| Unit of analysis | A single request | Session, client, campaign |
| Memory | None, each request stands alone | Yes, behaviour accumulates |
| Decision | Pass or block | Observe, throttle, challenge, block, deceive |
| Detection basis | Rule match | Rules, behaviour, context, reputation |
| Result | A list of blocked requests | An incident: who, when, how, at which stage |
| Question | Is this request malicious | What is this attacker doing |
A modern attack is not a single request. It comes in stages: first reconnaissance (which technology is in use, which paths exist), then probing (which parameter responds), then exploitation. Taken on its own, a request from any one stage can look harmless. Only when they are viewed together does the attack become visible.
A classic WAF does not see the first two stages, because it does not connect requests to each other. ADR does see them, because it remembers the session.
A foreign cloud WAF takes your traffic into its own network. It terminates TLS (the encryption between the browser and the server) abroad and sees the contents of your requests on its own servers. For banks, insurers and the public sector this is not a question of technical convenience. It is a legal one.
Honeypot is located in Uzbekistan. Traffic does not cross the border, TLS is terminated at a local point, and logs are stored locally. If you require it, the entire platform can run inside your own infrastructure.
A second effect: latency. A request from a user in Tashkent does not travel to Frankfurt or Singapore and back.
Many WAFs look for attacks with text patterns (regular expressions). This approach has two problems: an attacker can work around the pattern, and normal traffic can match the pattern by accident and be blocked in error.
SQL injection: the text of the request is passed through an SQL tokeniser and its grammatical structure is analysed. That is, the system does not ask “is UNION SELECT written here”, it asks “is this parameter changing the structure of the SQL query”.
XSS (cross-site scripting): a DOM state machine is used. The context the input lands in inside the browser is modelled (HTML text, attribute, JavaScript, URL), and it is judged on whether it is dangerous in that context.
The practical result: obfuscated attacks are detected too, and legitimate traffic is blocked in error less often.
Blocking an application-layer (L7) attack in user space still spends server resources. We block an identified source at the kernel level: the packet never reaches the application layer at all.
This is where the difference shows during high-volume attacks: the blocking does not itself become a load.
“Block or allow” is a blunt instrument. Block a suspicious but unconfirmed client straight away and you lose a real customer. Let it through and you let the attacker through.
Honeypot responds in stages.
| Stage | What happens | Noticeable to the user |
|---|---|---|
| Observe | Behaviour is recorded, score accumulates | No |
| Throttle | Request rate is limited | Almost none |
| Challenge | A browser challenge is sent | A few hundred milliseconds |
| Block | The request is refused | Yes |
| Deceive | The attacker is given a fake response | They do not know they are blocked |
The last stage stands apart: an attacker who knows they are blocked will look for another way. One who does not know wastes their time.
The threat data of global vendors is global. A campaign aimed squarely at the financial sector in Uzbekistan may not show up in it, because they have no sensor here.
We do. Every protected site on the platform also works as a sensor. An attacker profile identified at one customer is immediately scored as high risk at the others.
Three screens showing the platform's daily work: overall state, the session list, and the relation graph of a single session. Captured from a running panel; visitor IP addresses are masked.
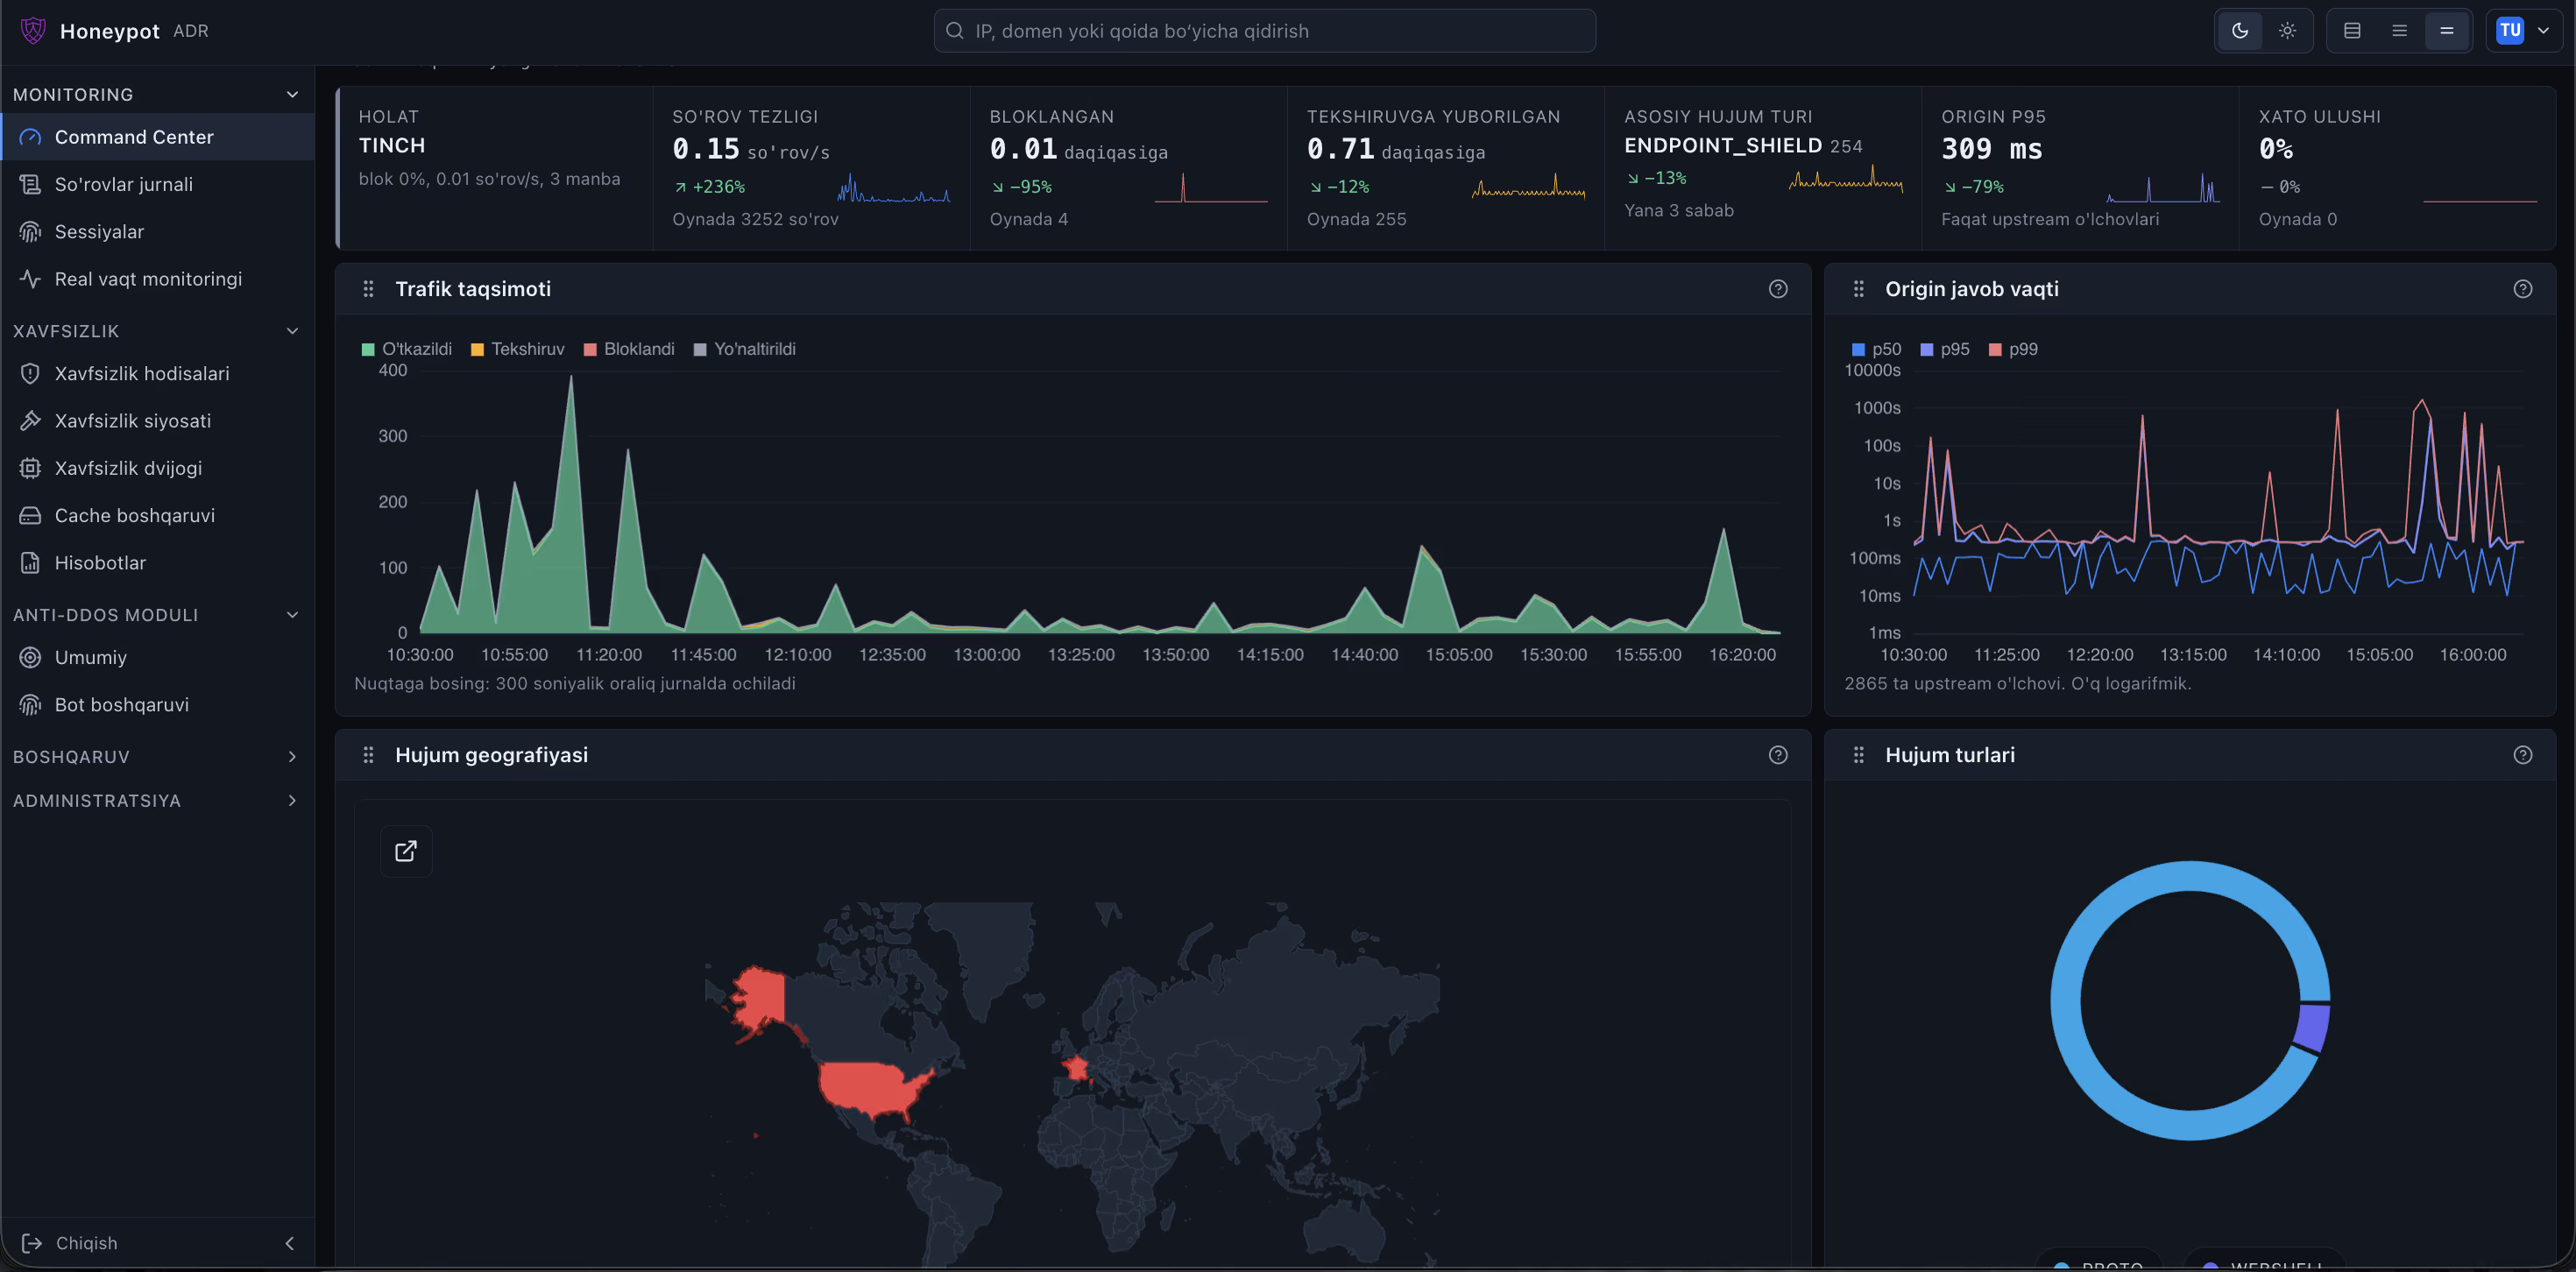
State, request rate, blocked and challenged requests, the leading attack type and origin response time on one screen. Below: traffic distribution, p50/p95/p99 latency, attack geography and attack types. Every point leads into the request log.
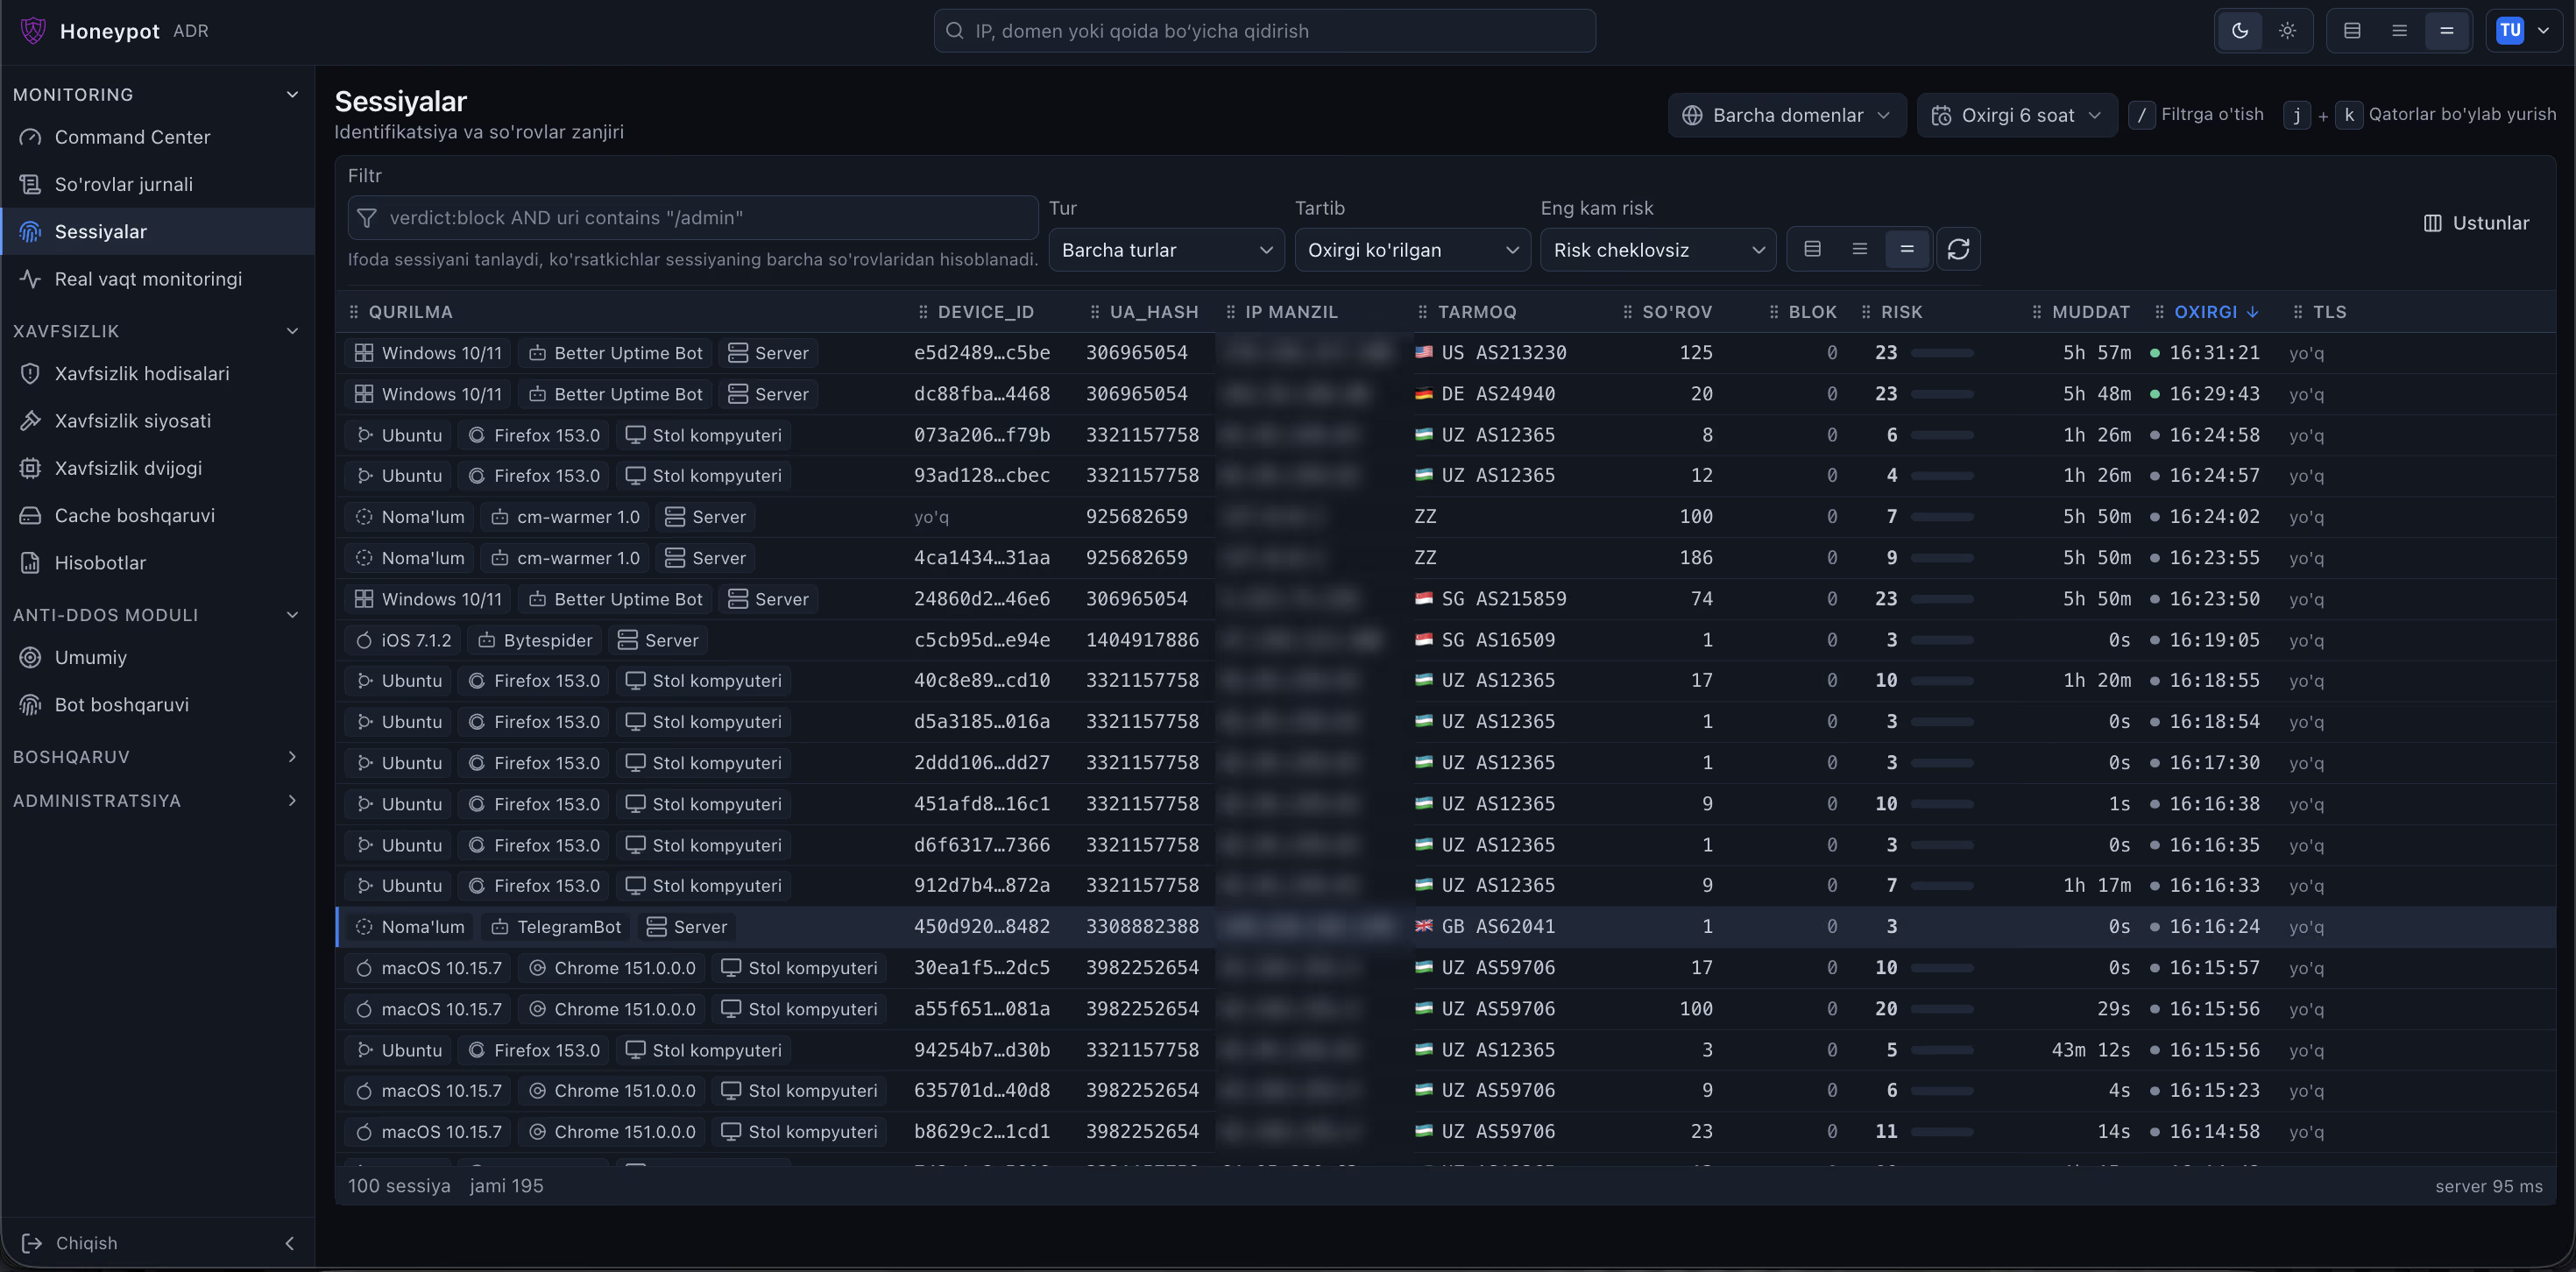
Requests are folded into one trail per device: operating system, browser, DEVICE_ID and UA_HASH, network (ASN and country), request count, blocks, risk score and session duration. Above it, the expression language — for example `verdict:block AND uri contains "/admin"`.
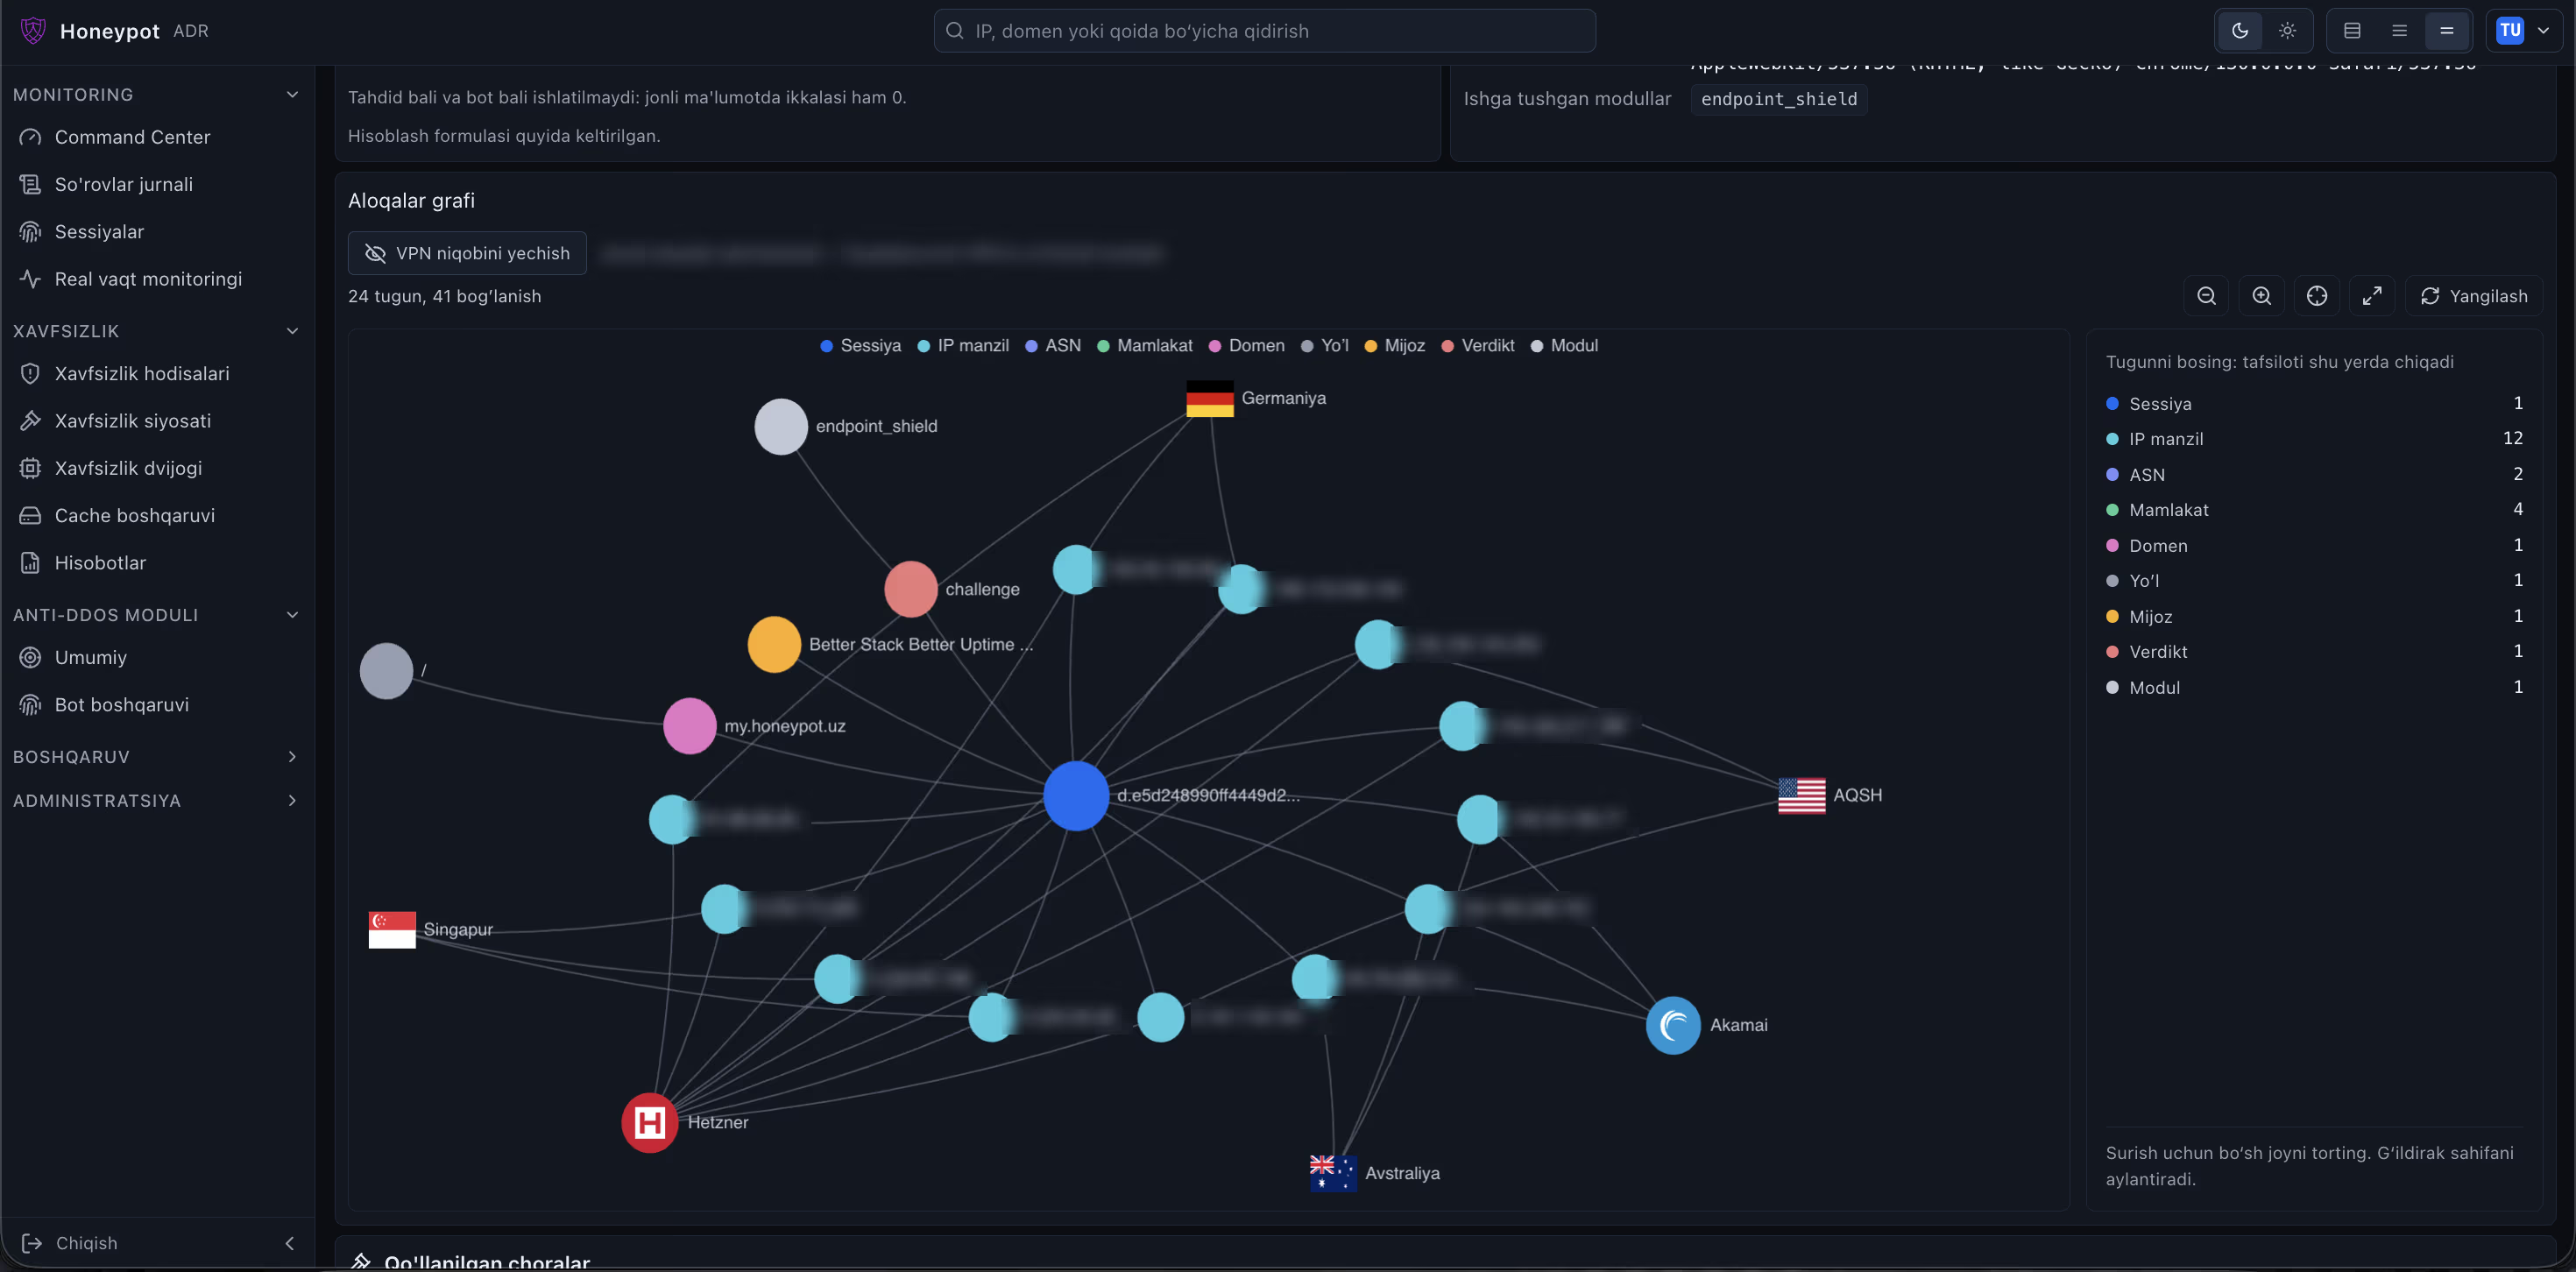
Everything connected to one session: IP addresses, ASNs, countries, the domain, the path, the module that fired and the verdict returned. This is where one device is visibly standing behind a dozen addresses — which is what the “unmask VPN” control is for.
Detects and stops attacks aimed at the application.
Against distributed denial of service attacks at the network and application layers.
Separates automated traffic from human traffic.
Seeing what is happening.
The ability to inspect every request.
The visible part of the ADR core.
Fitting protection to your own application.
Setting out exactly who gets in and who does not.
Reducing the load that reaches the origin server.
Reporting status on a regular basis.
Team, permissions and integration.
In the cloud option, changing a DNS record is enough. Most of the time goes on tuning: we prepare a policy that fits your application and start it in monitoring mode first.
A new policy does not start blocking straight away. It runs in monitoring mode first, what would be blocked is measured, exceptions are added, and only then is it switched on.
Because the platform sits locally, the path a request takes is shorter than with foreign solutions: traffic does not cross the border.
The system can be set not to stop traffic during an outage. That setting is your choice: security first, or continuity first.
You can upload a certificate or turn on automatic issuance. Expiry is flagged in advance.
Events are sent to your SIEM (security information and event management system). Webhooks and an API are available.
We run a free analysis: for one week we watch the automated scanning and attack attempts aimed at your domain, and give you the result as a report. Nothing is blocked at this stage and no configuration is required.